Benthic cover composition, quadrats analysis with CoralNet
Context
As part of the study on the relative abundance of Pocillopora sp. GitHub within the lagoon of Mo’orea (French Polynesia), the analysis of benthic composition is essential to better understand the abundance of Pocillopora in relation to the environmental conditions to which these organisms are exposed.
Background of the sampling protocol
The study includes 12 distinct sites map here. All sites were randomly generated while excluding lagoon areas under Marine Protected Area (MPA) status, as well as areas currently under scientific study by research institutes located on the island of Mo’orea.
At each site, between 3 and 6 transects were deployed. Each transect measured 50 m in length and 50 cm in width (25 m²), all arranged parallel to each other and perpendicular to the reef.
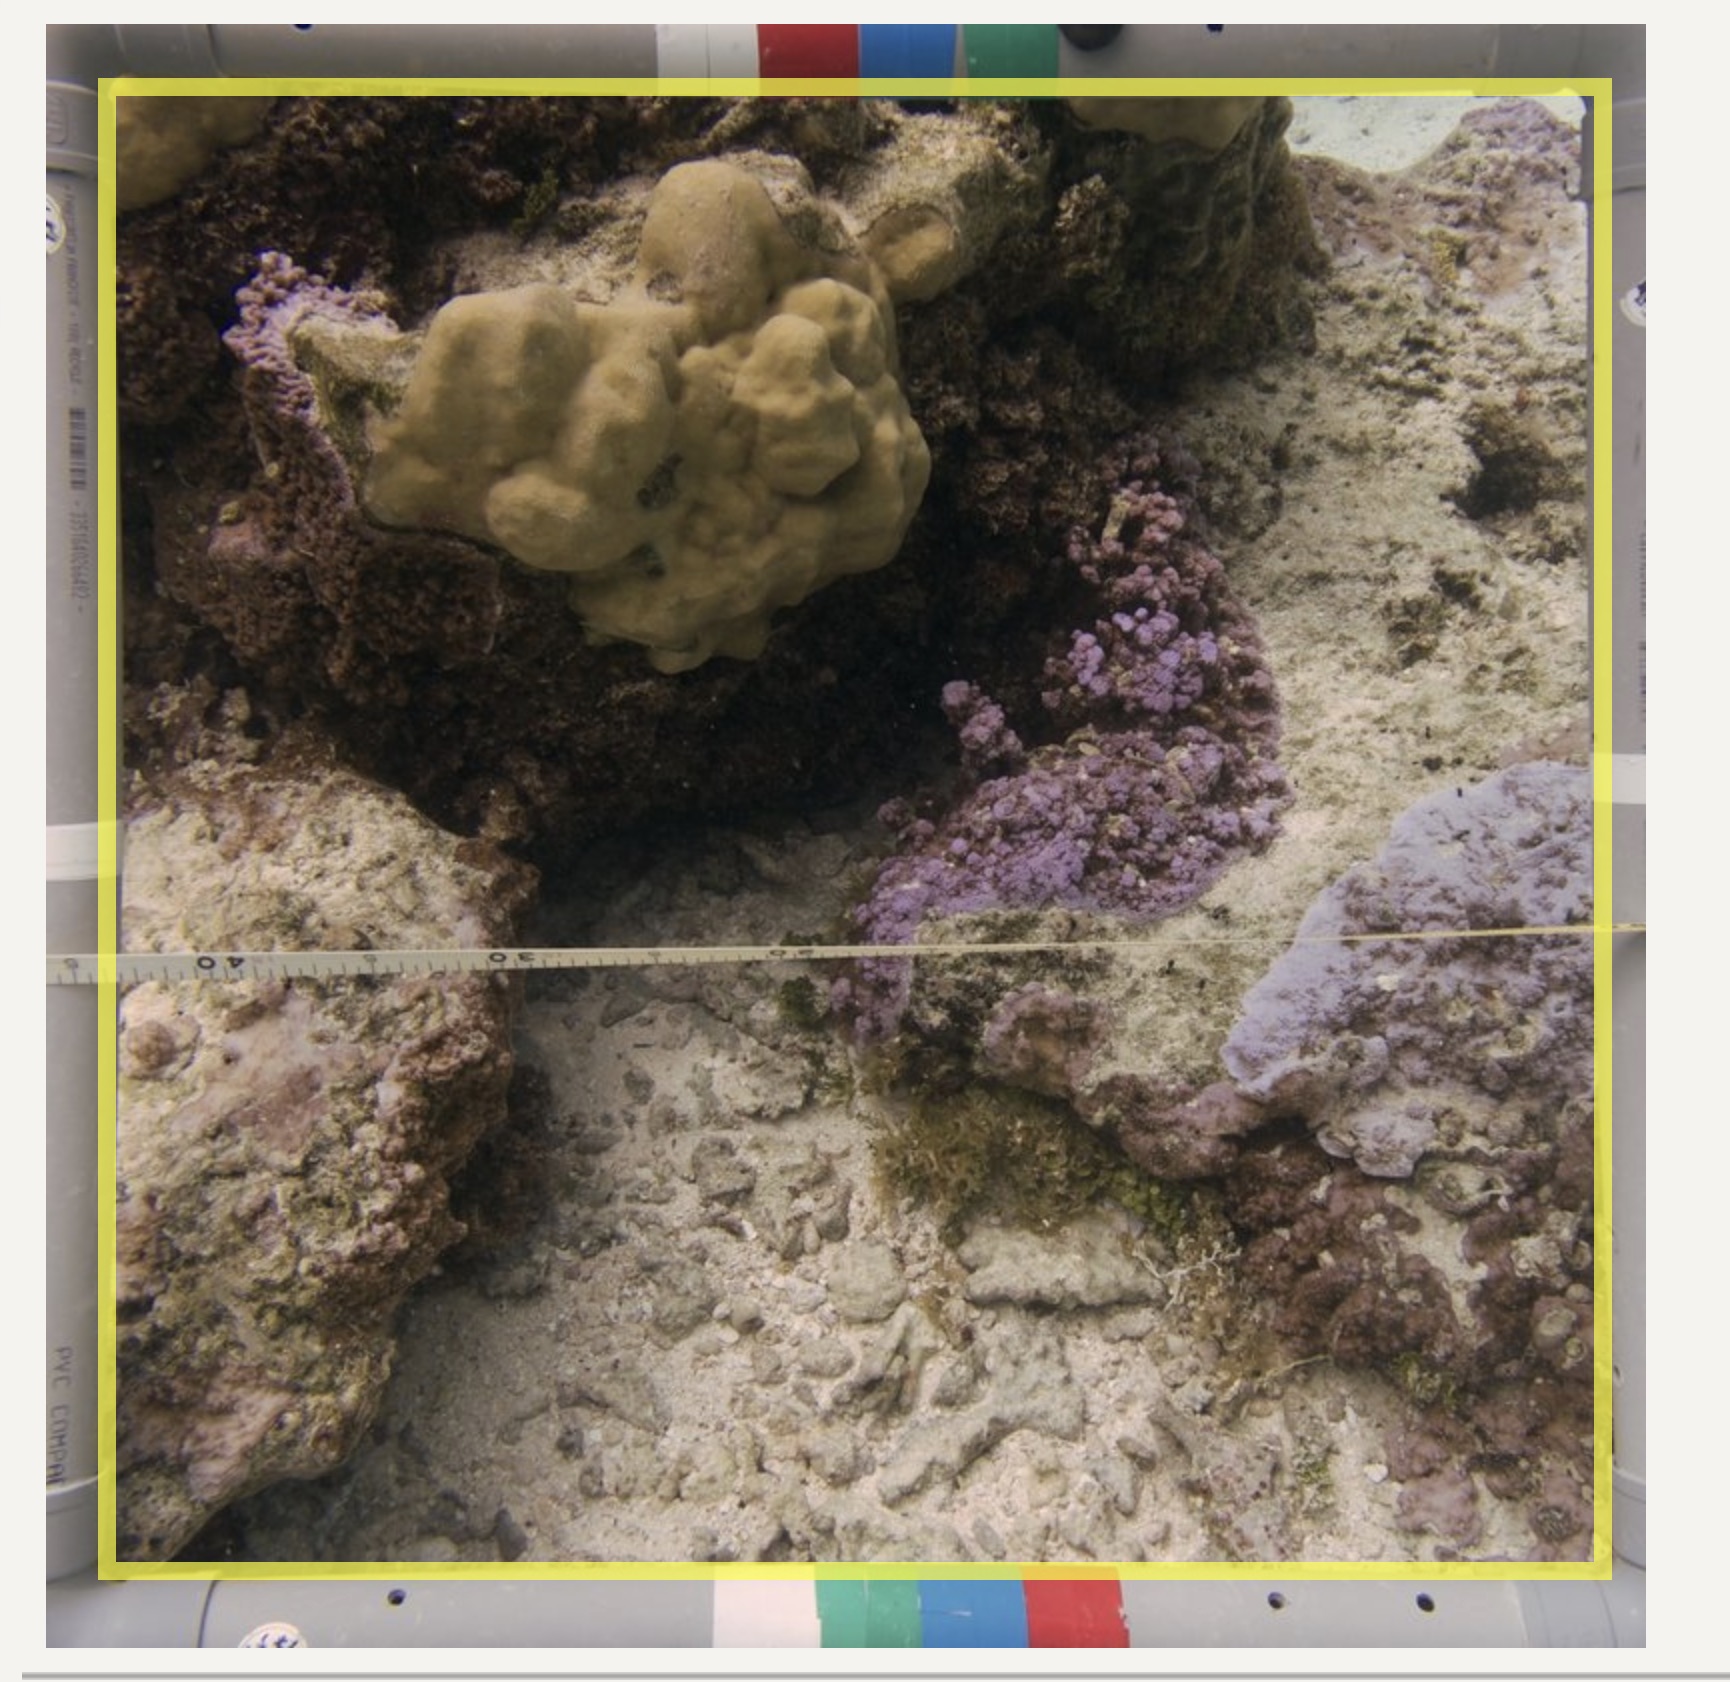
After installing each transect, it was filmed to maintain a visual record. Starting from the 0 m mark, a quadrat measuring 50 cm × 50 cm was placed and photographed every 2 m. Each transect therefore contains 26 photographs.
Due to lagoon topography and shallow water depth at some sites, certain quadrats could not be analyzed because of poor photo orientation or because reconstruction of the transect position was not possible during post-fieldwork processing.
Number of Available Quadrats per Site
The number of quadrats per site or transect may vary depending on benthic complexity. As a result, not all transects contain the same number of quadrats.
All related information regarding this variation can be found here.
Data Analysis Protocol
Due to the complexity of the sampling process, some photoquadrats could not be used for analysis, partly because of the angle at which the photos were taken or due to insufficient image sharpness.
All images were cropped and adjusted using white balance correction to ensure that they shared the same visual characteristics prior to analysis with the lociciel “Photo” on MacOS26.
The images were then uploaded to CoralNet®, where the benthic analyses were performed.
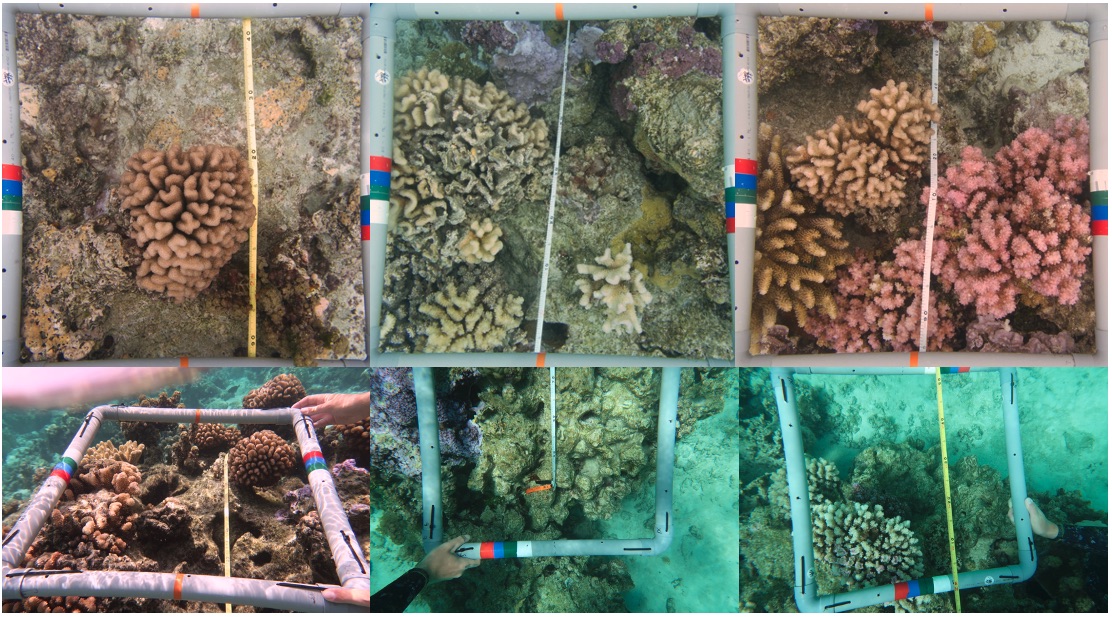
Example of good and poor photoquadrats (first row: Good, Good, Good; second row: Bad, Bad, Bad).
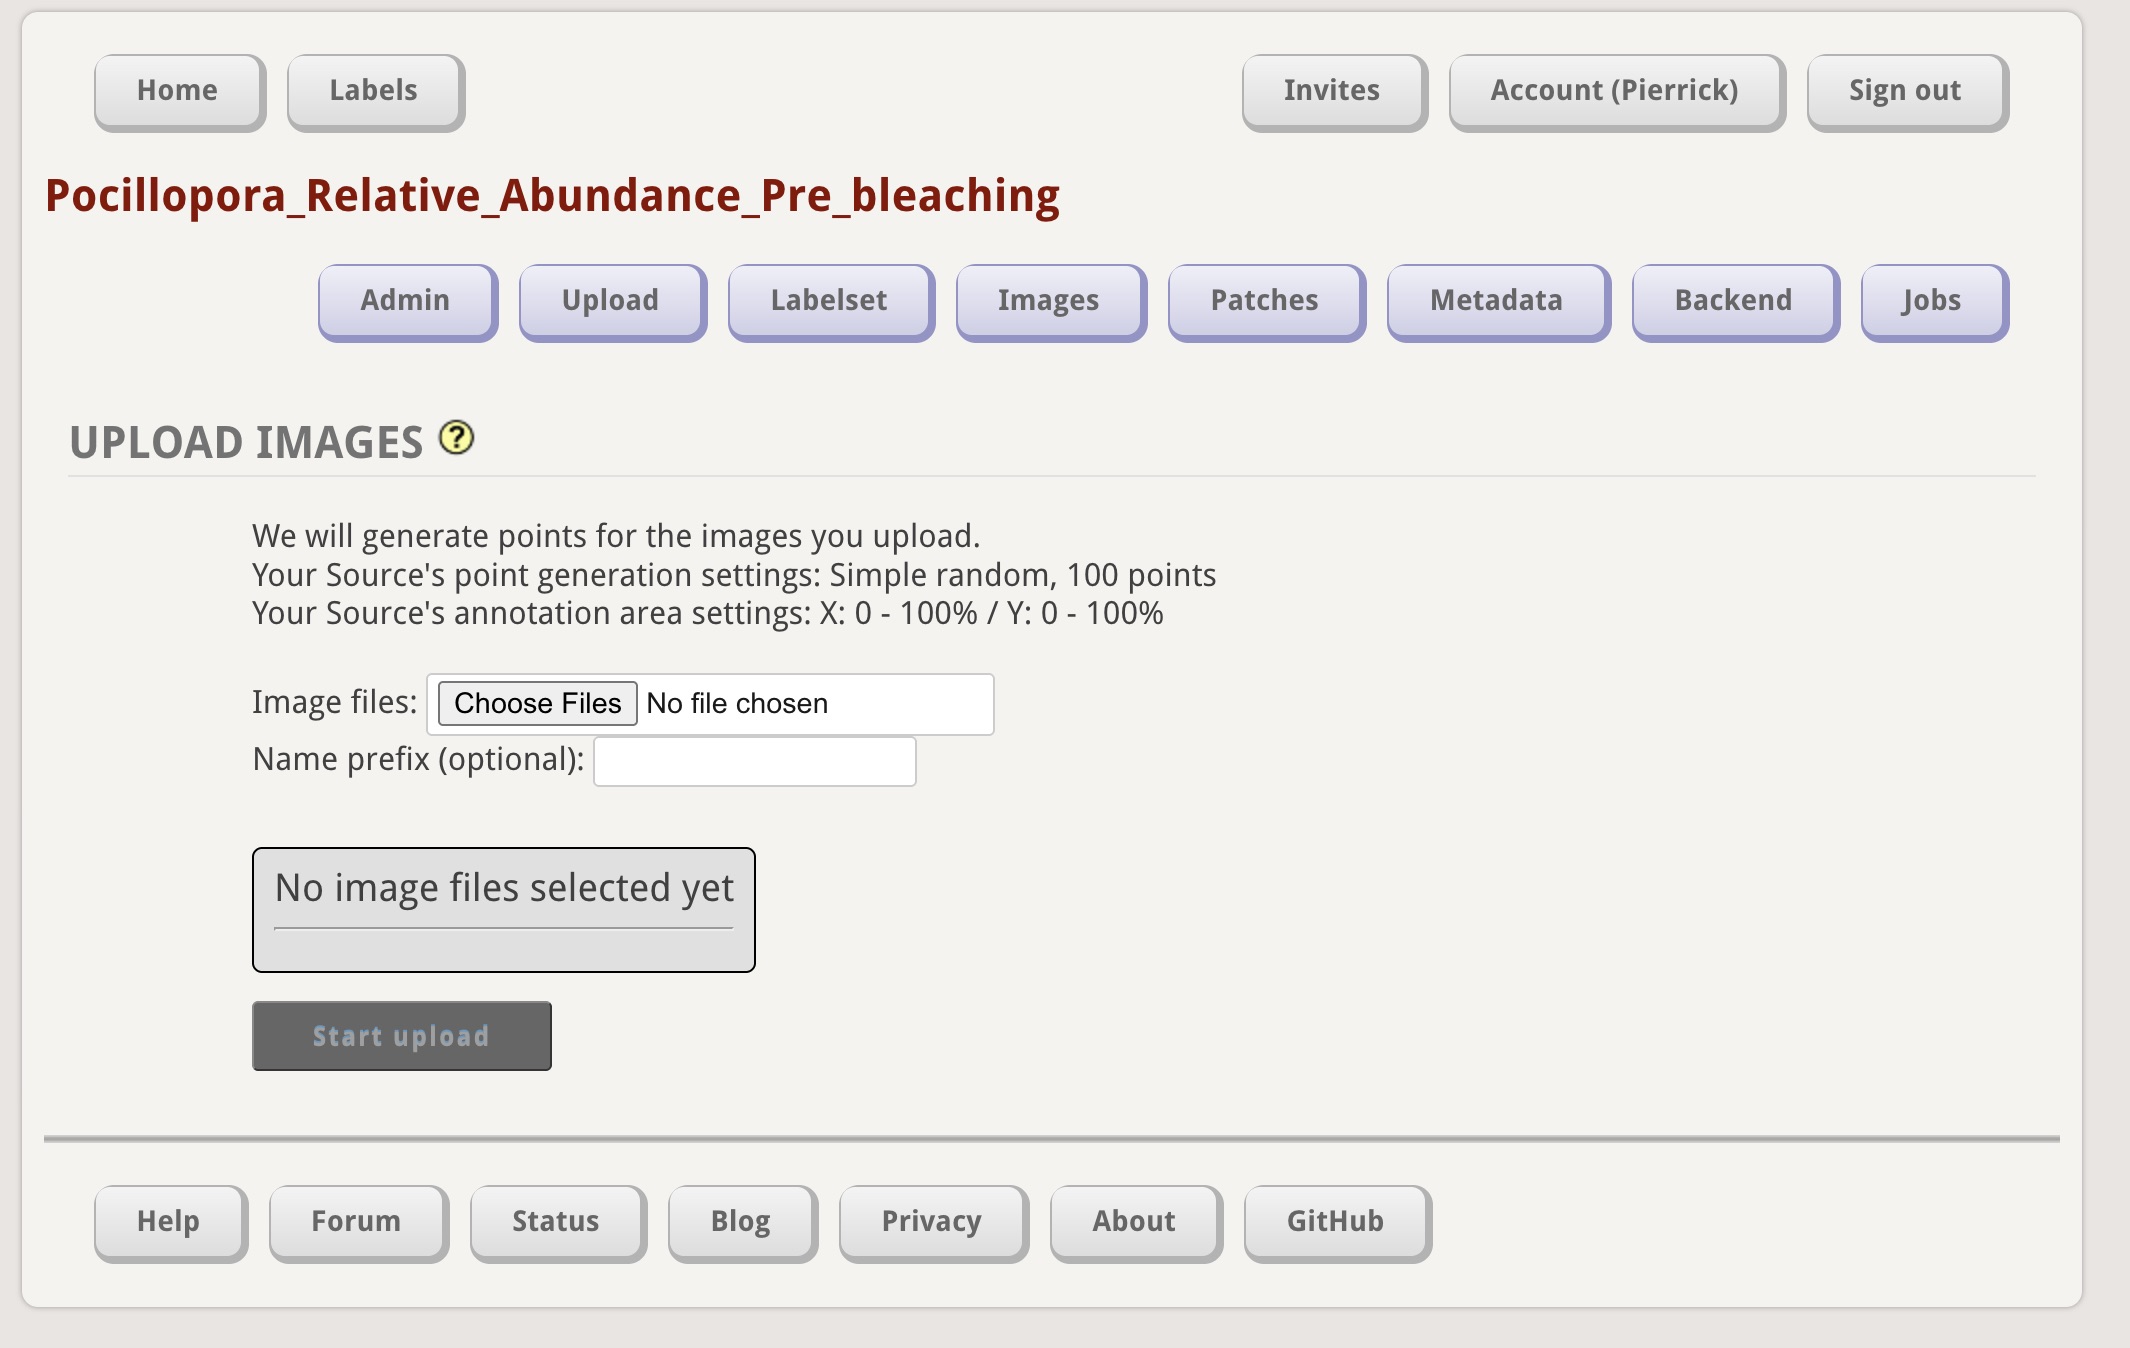
CoralNet® Image Annotation Workflow
1. Upload images to CoralNet® using the “Upload” option.
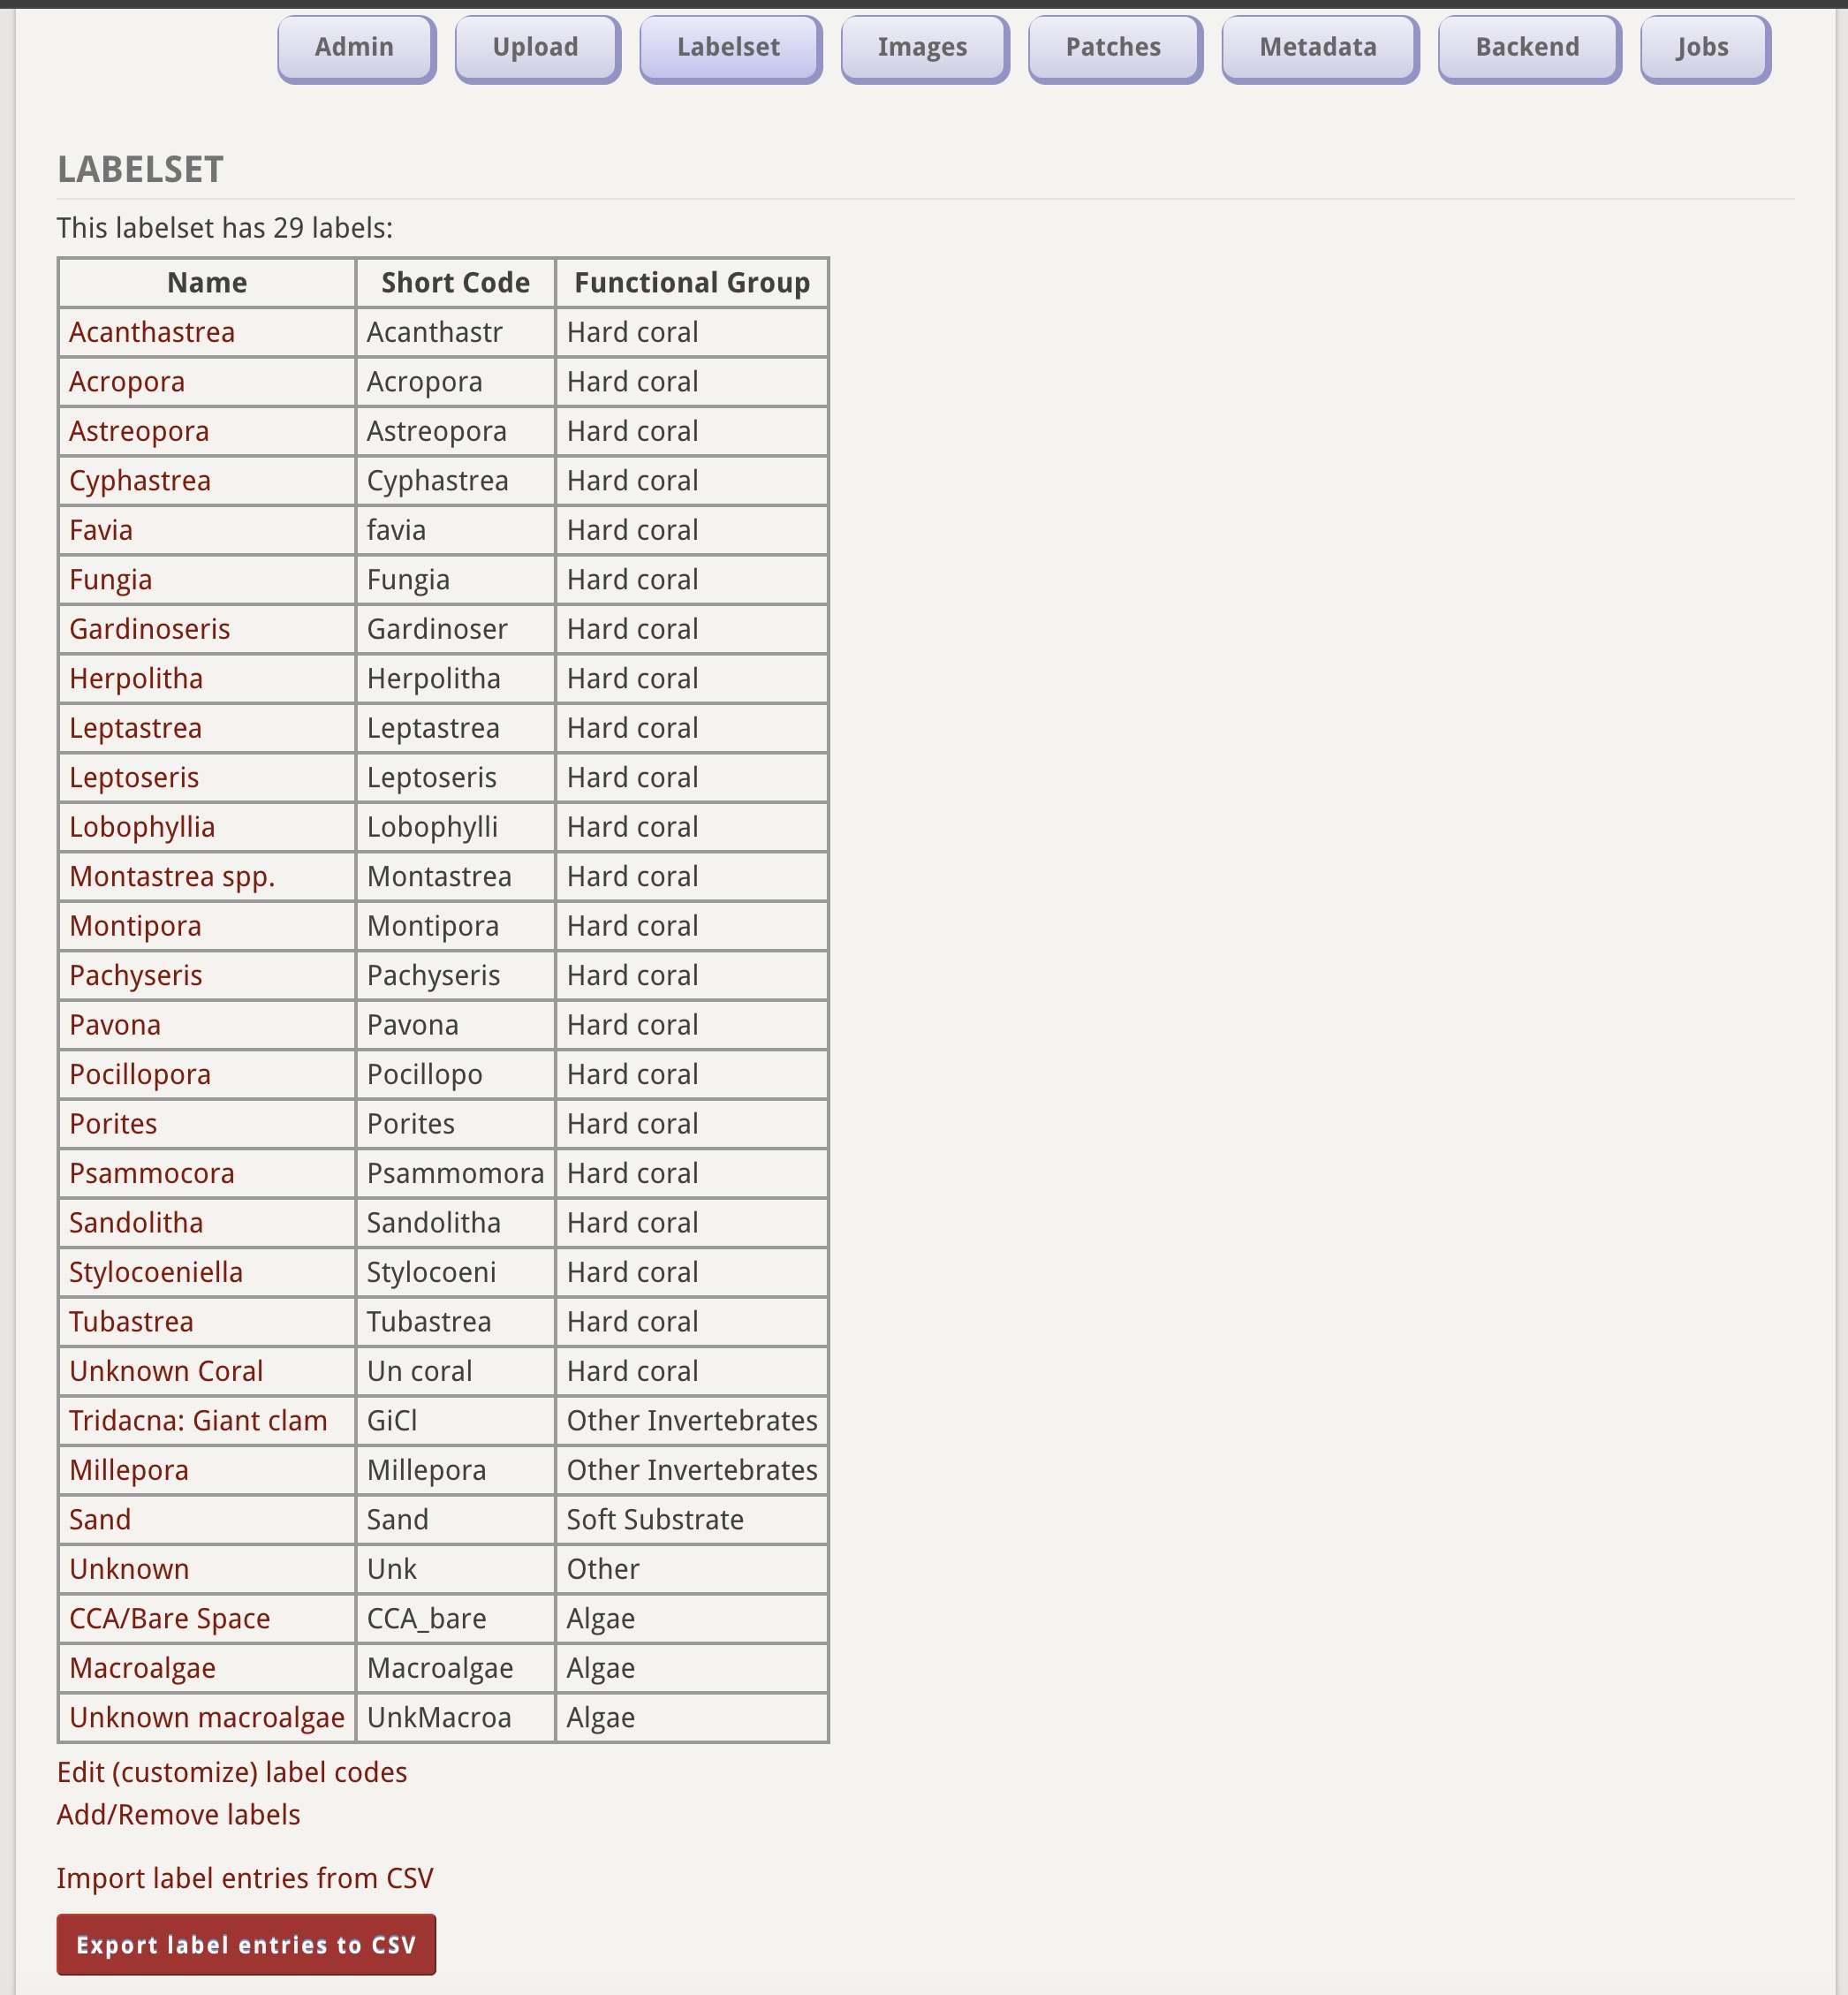
2. Create a label set containing the benthic categories or taxa that will be used for image annotation.
3. Once the images have been uploaded, crop each image if necessary before generating annotation points.
4. Generate annotation points on the selected image using the CoralNet® point generation tool.
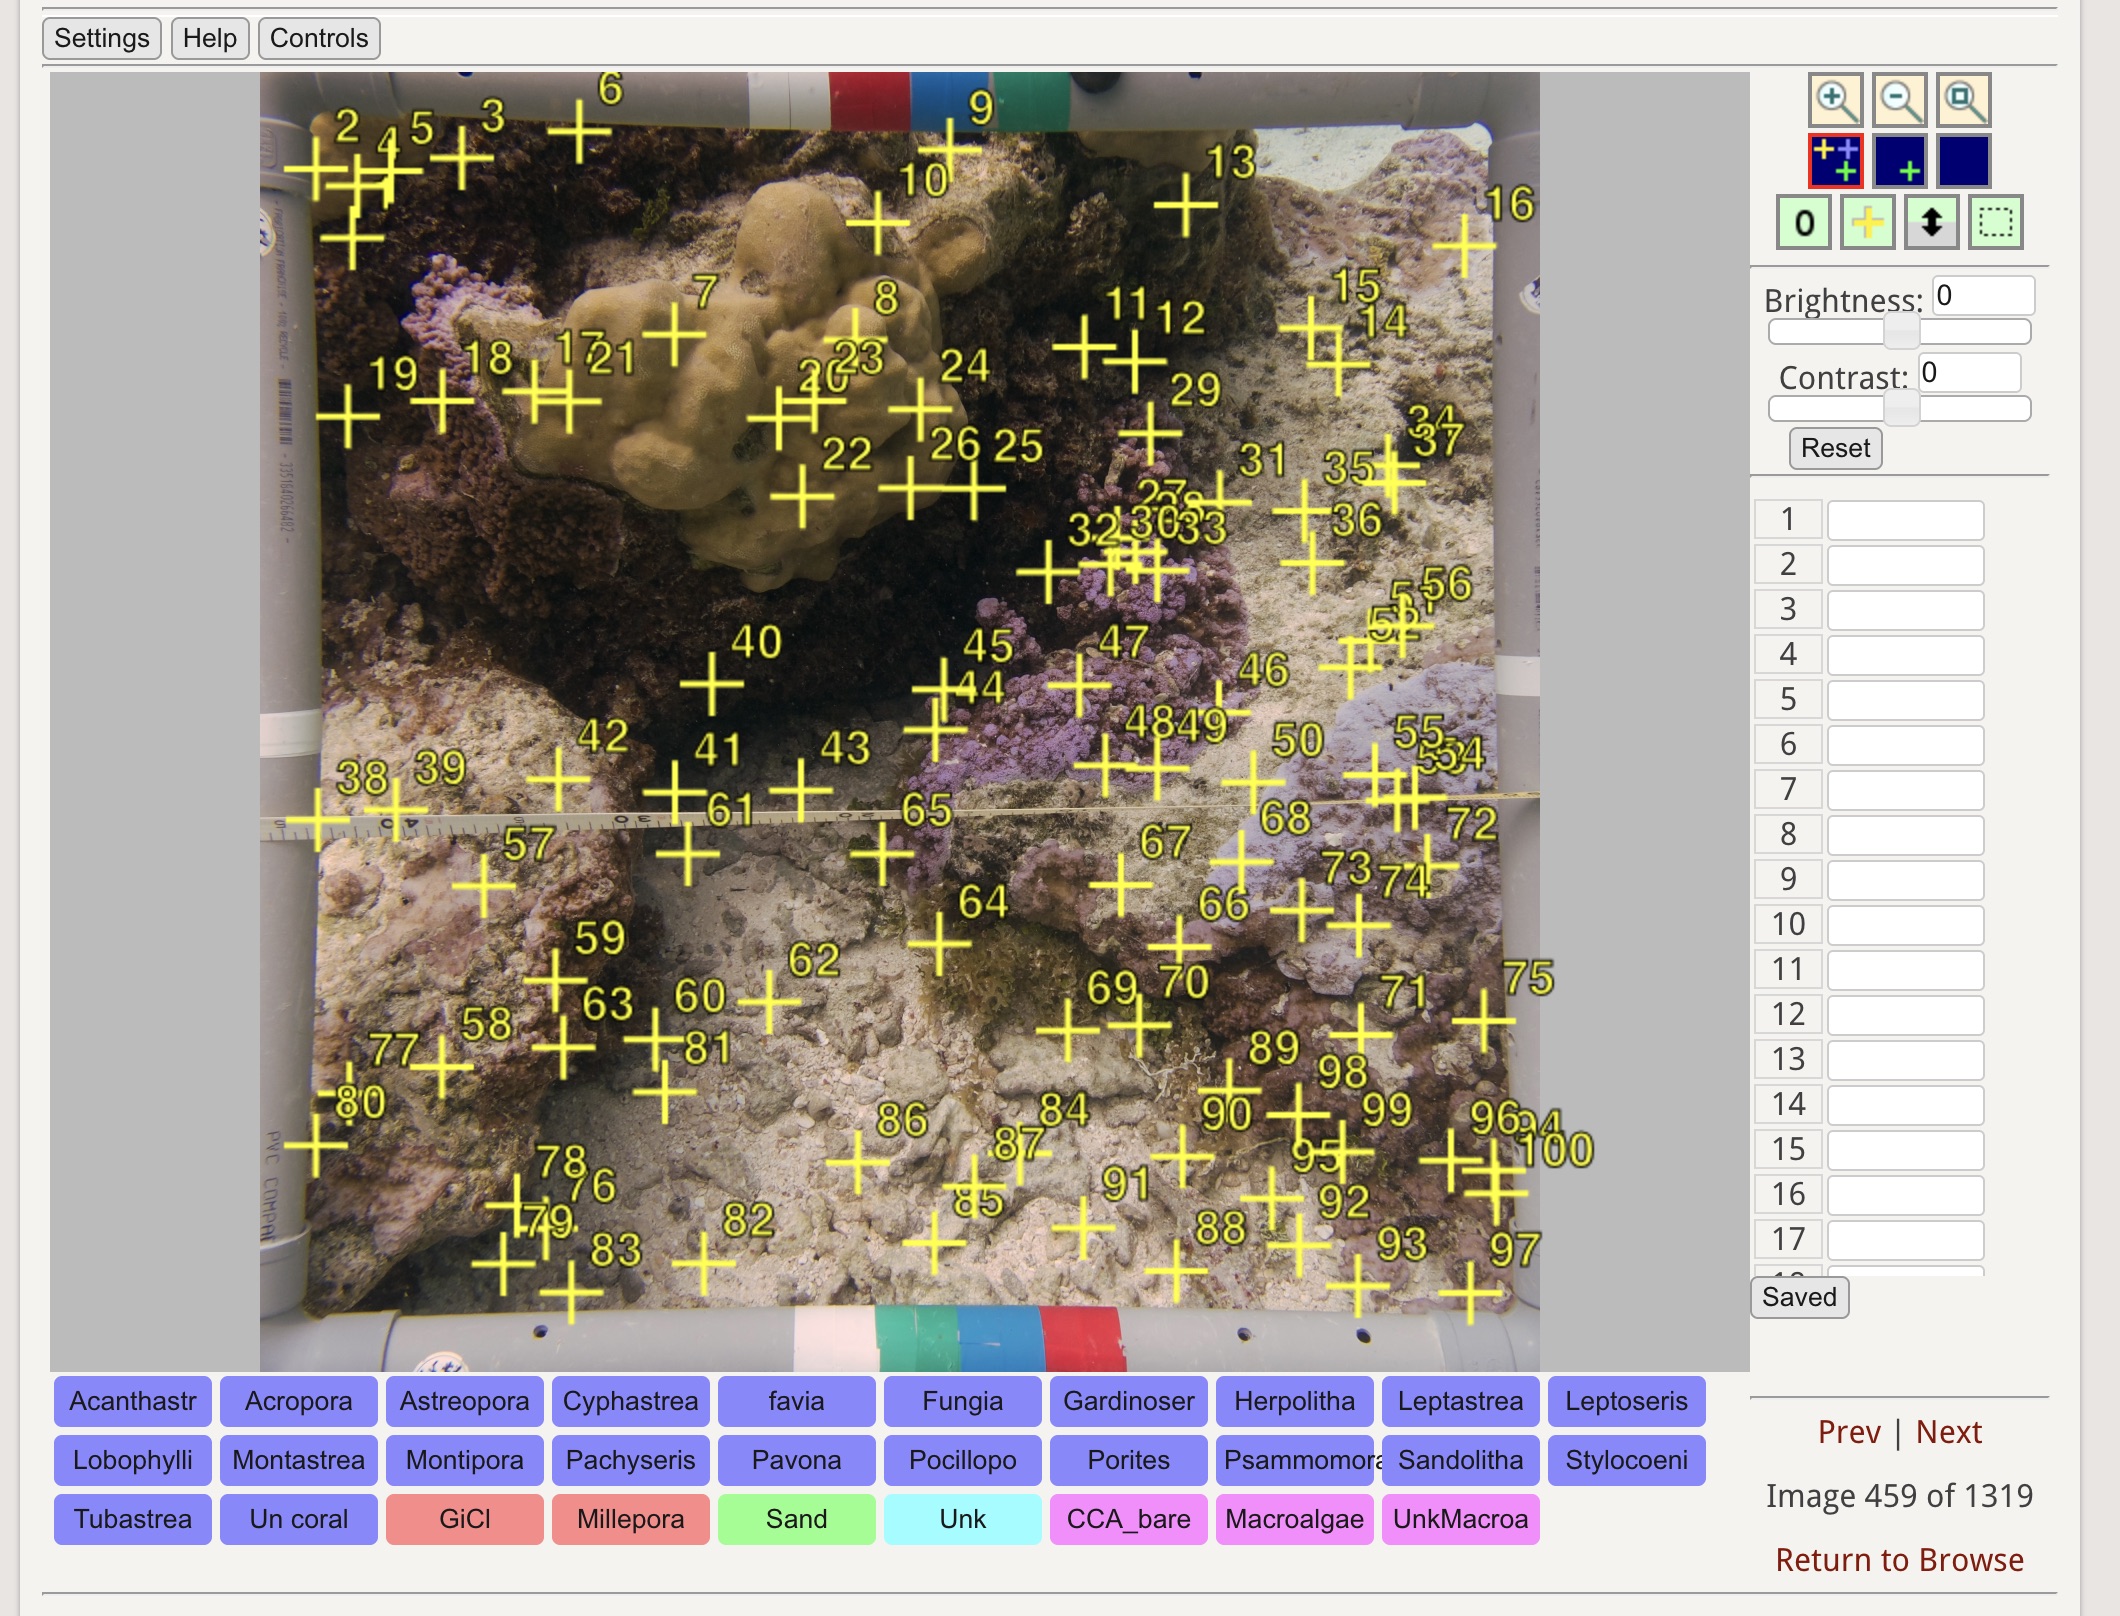
5. Identify and validate all annotation points on the image according to the selected label set.
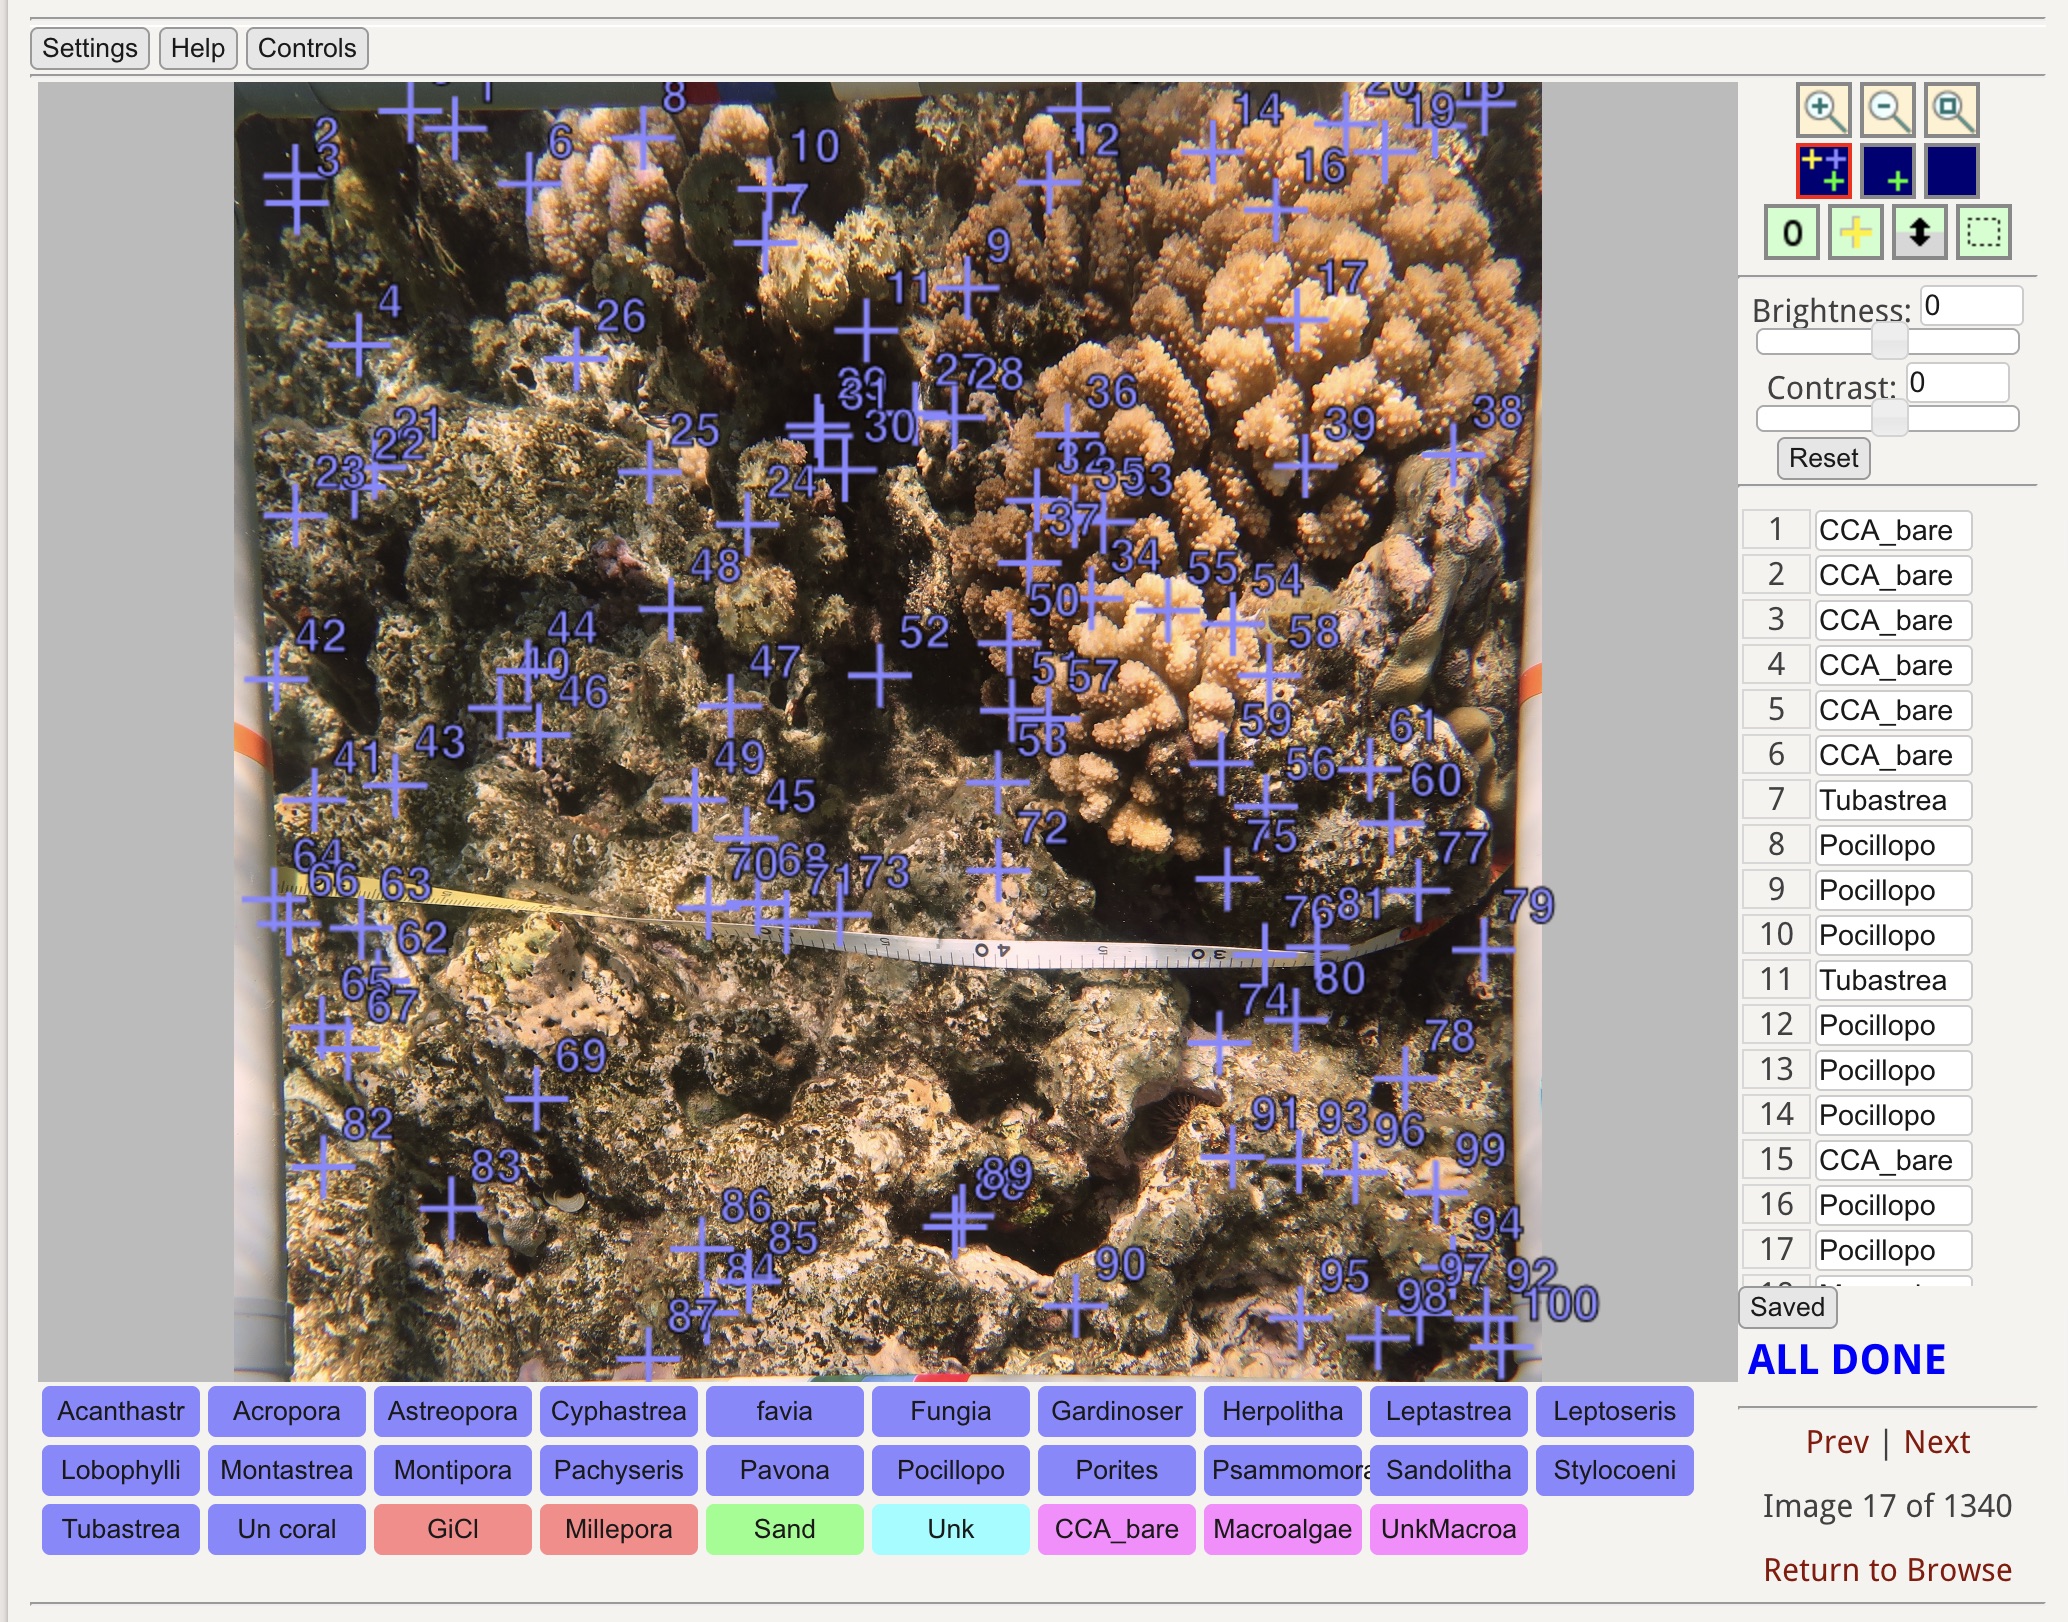
6. After completing the annotation, click “Save” to record the classifications.
7. After all images have been fully annotated and validated, navigate to the “Images” tab. Use the table located above the image gallery to select the images you wish to export. Once the desired images are selected, scroll to the bottom of the page to export the annotation dataset.
8. Review the exported dataset for completeness and accuracy, and proceed with data analysis in RStudio®.
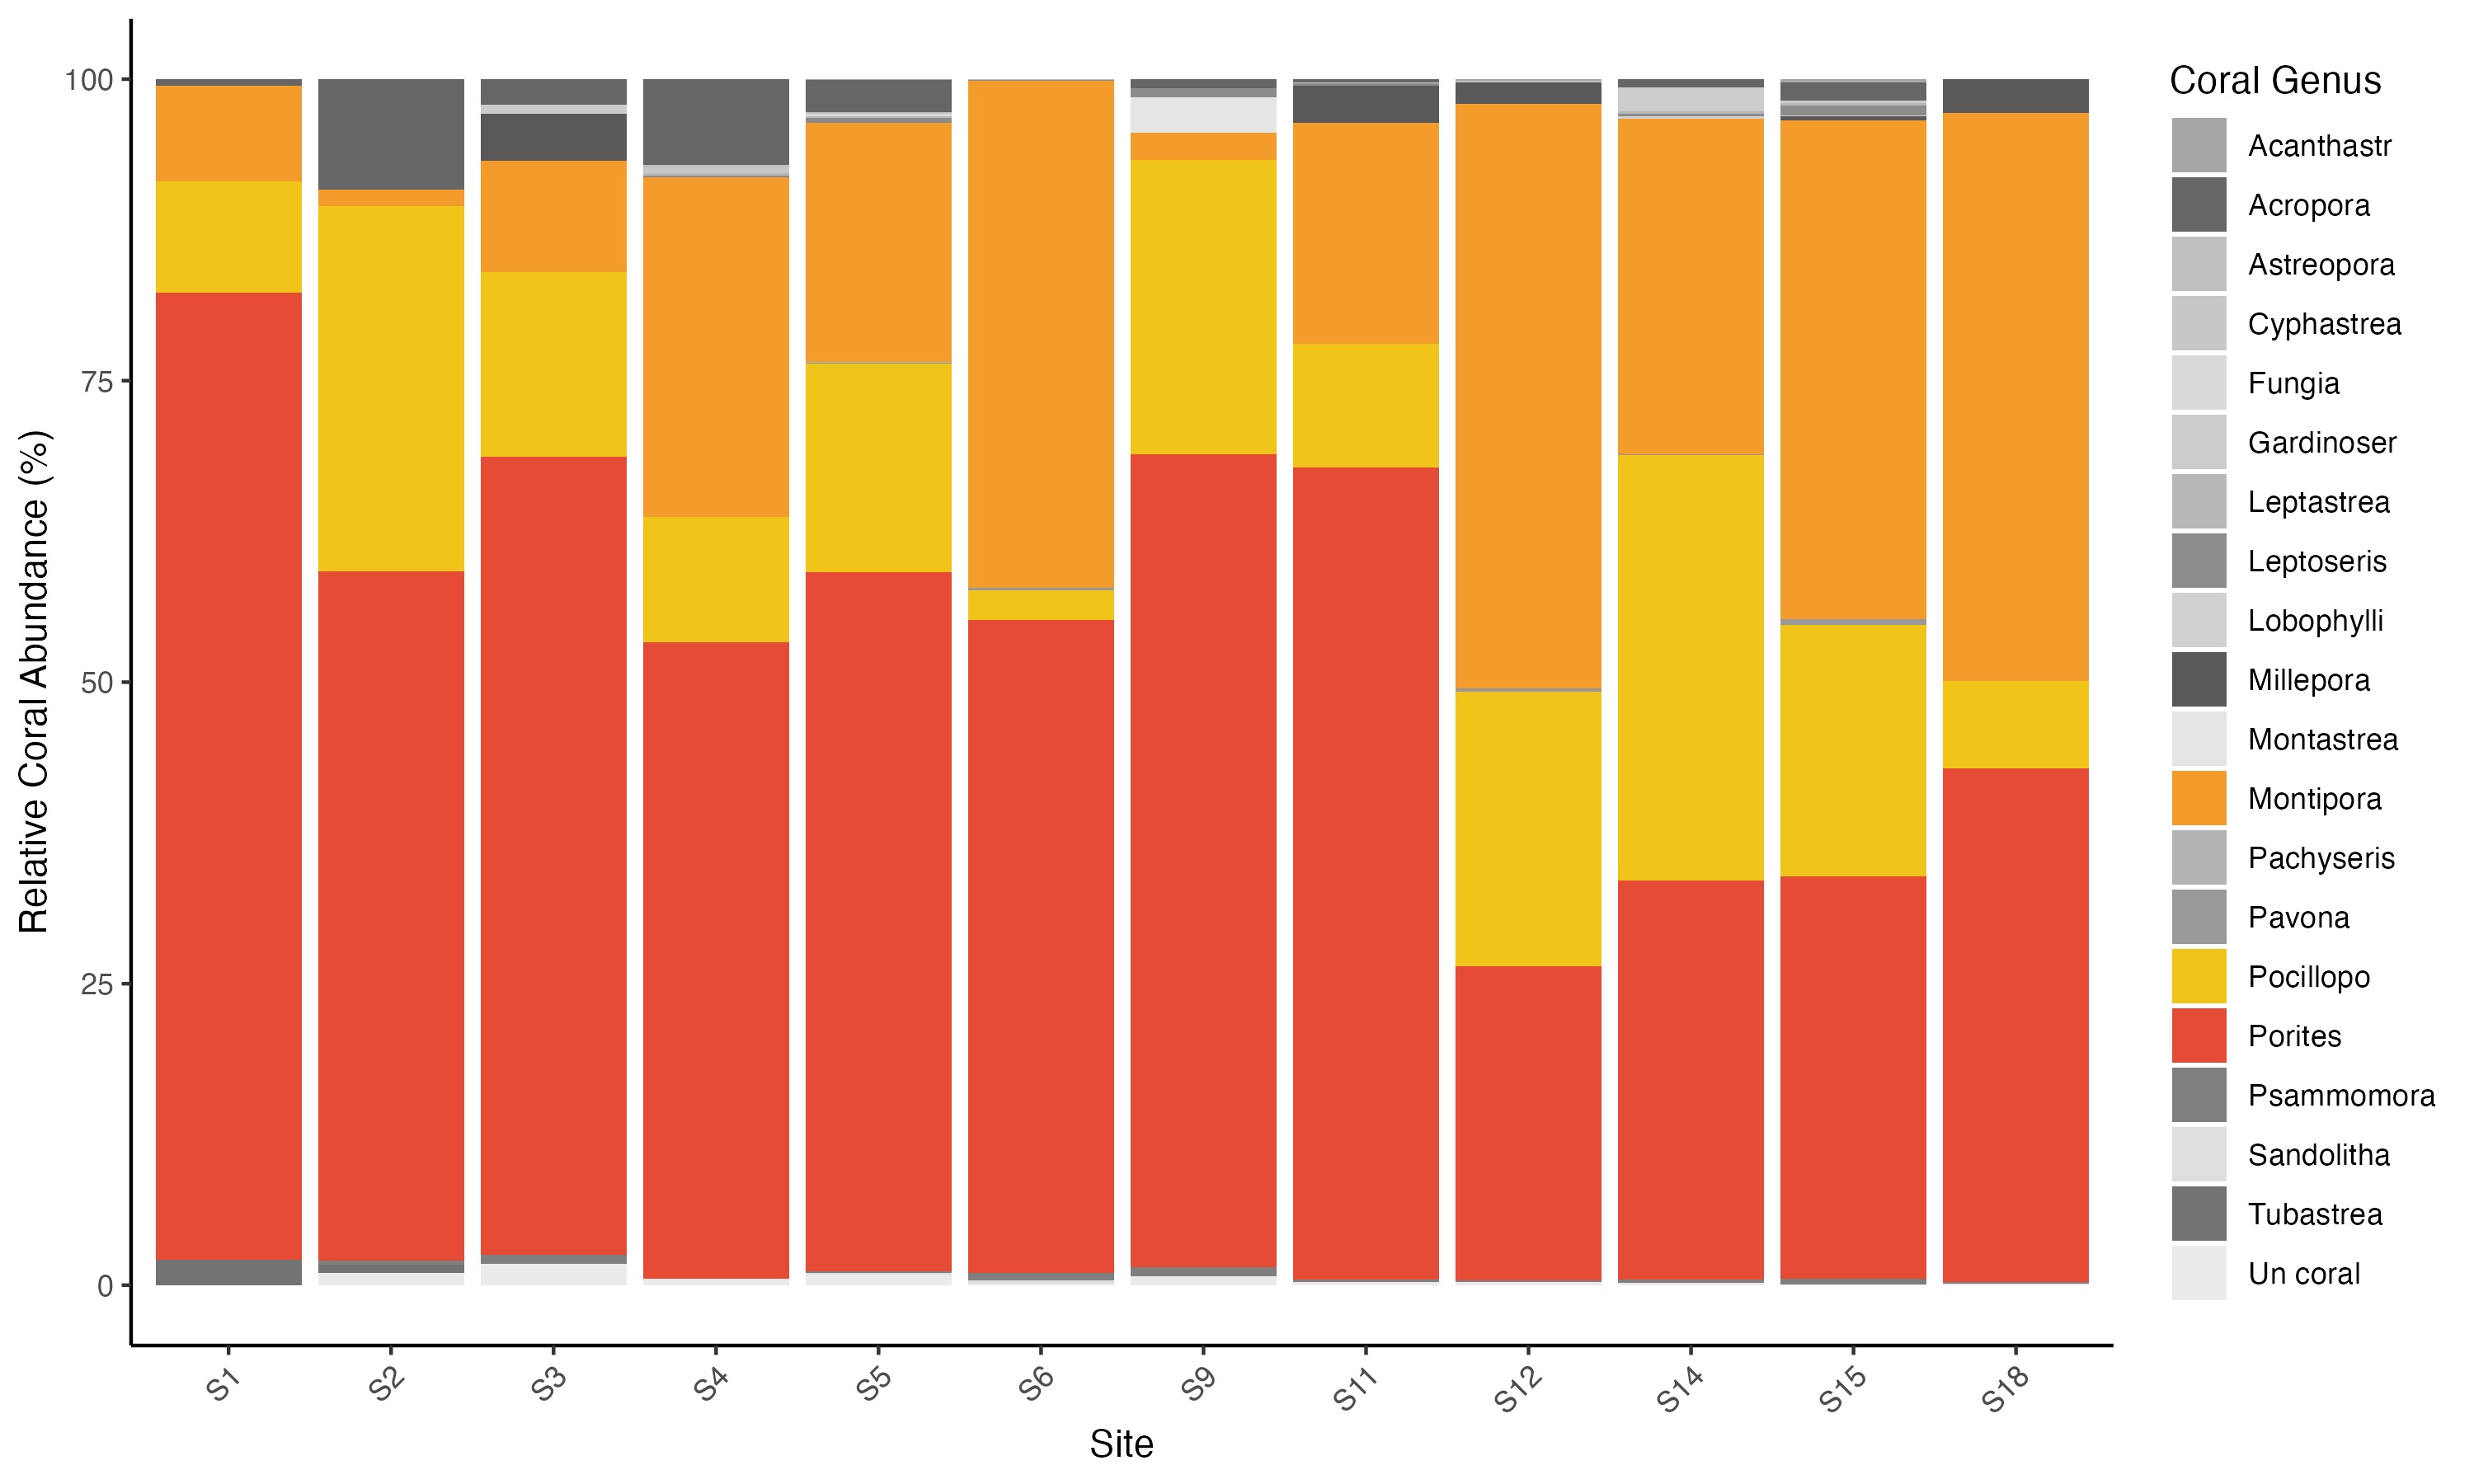
Example of graph after analysis